The Visual Display of Quantitative Information Bracket
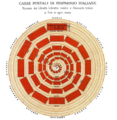
Regular polls posted to Witscord by Staz. The images are from the book The Visual Display of Quantitative Information by Edward R. Tufte.
Bracket
Round 1
| Match | Contestant | Votes |
|---|---|---|
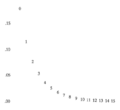
| 1 | 4 datasets with identical linear model | 2 |
| graphs of 4 datasets with identical linear models | 4 | |
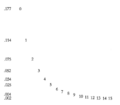
| 2 | solar radiation and stock prices | 6 |
| univariate plots fail to show outlier A | 1 | |
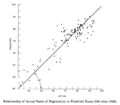
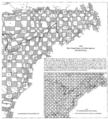
| 3 | cancer rates (m/f) age-adjusted by county | 2 |
| trachea/bronchus/lung cancer rates | 1 | |
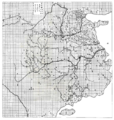
| 4 | Map of the Tracks of Yü the Great | 4 |
| stomach cancer rates (m/f) age-adjusted by county | 2 | |
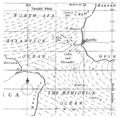
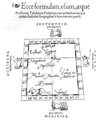
| 5 | Cosmographia (1546) | 2 |
| global trade winds and monsoons | 4 | |
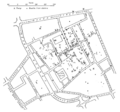
| 6 | Location of cholera deaths in central London | 4 |
| Trade winds and monsoons between and near the tropics | 1 | |
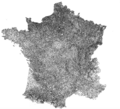
| 7 | French wine exports in 1864 | 10 |
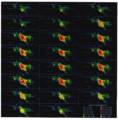
| Galaxy map | 1 | |
| 8 | Galaxy map 2 | 2 |
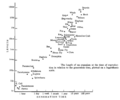
| Inclinations of planetary orbits vs Time | 2 | |
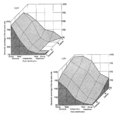
| 9 | Radio emissions from Jupiter | 3 |
| Soil temperature at various depths vs Time | 3 | |
| 10 | New York City's weather for 1980 | 3 |
| Train schedule for Paris to Lyon | 6 | |
| 11 | CHART of IMPORTS and EXPORTS to and from ENGLAND | 5 |
| Exports and Imports of SCOTLAND from Christmas 1780-81 | 0 | |
| 12 | Birth, death, and reign of English rulers (1660-1860) | 1 |
| CHART showing Price of Wheat & Wages (1565-1824) | 6 | |
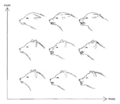
| 13 | Horse tracks at different paces | 4 |
| Starfish turning itself over | 5 | |
| 14 | advancing gecko | 10 |
| Undulations of the dorsal fin of a descending sea-horse | 1 | |
| 15 | Man in black velvet photographed in stick-figure images | 5 |
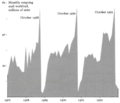
| Outgoing mail of the U.S. House of Representatives | 2 | |
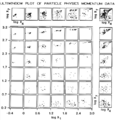
| 16 | Magnetic flux vs Time | 4 |
| Variation in total US retail sales | 5 | |
| 17 | collapse of bridge in 1840 | 3 |
| Napoleon's Russian Campaign (1812) | 5 | |
| 18 | Air pollution in southern California | 5 |
| Life cycle of Japanese beetle | 4 | |
| 19 | Area, population, tax revenue of european countries | 5 |
| Lung cancer death rate by country | 2 | |
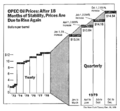
| 20 | Inflation vs Unemployment | 5 |
| Meta analysis of reported thermal conductivity of Cu | 6 |
Note: In the event of a tie, Just Kirb decided the winner.


